The transport transition aims to gradually replace the car as the primary means of transport with public transport. There are many reasons for this. As far as cars with combustion engines are concerned, these include climate protection, but also the reduction of accidents, noise, space taken up by parked cars, traffic congestion, environmental pollution from tyre wear, NOx emissions, particulate matter, high capital commitment, and so on. Unfortunately, we observe that this shift is progressing only very hesitantly, if at all. There are many reasons for this; one priority is to improve the quality of public transport services.
One indicator of the relationship between public transport and other modes of transport is the so-called modal split. Despite numerous efforts by all parties involved, it has not changed significantly over the years, as the following graphs show:
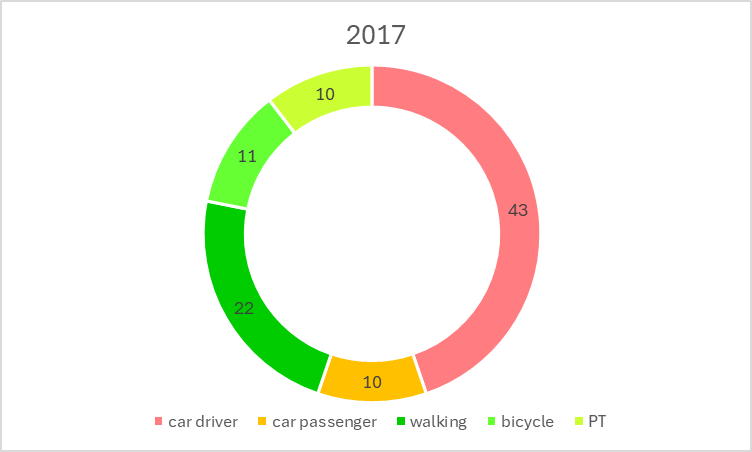
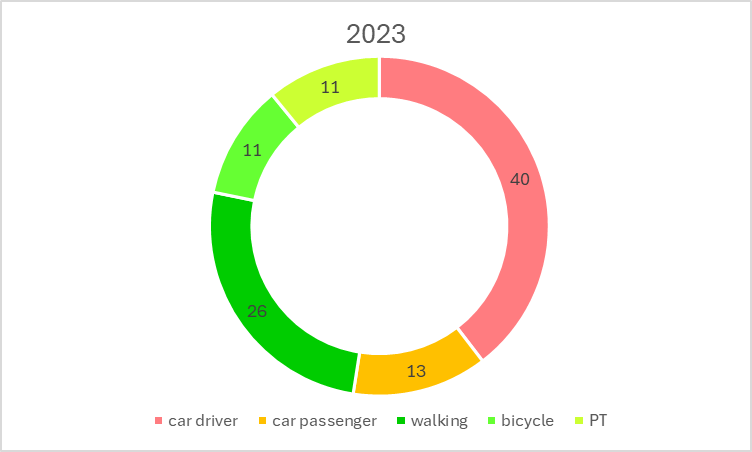
Modal split in 2017 and 2023 (C) datagon GmbH, data from Google (BMDV)
We can see that the proportion of private car journeys has remained the same; only the breakdown between drivers and passengers has changed. However, the proportion of private car journeys remains at 53%. The proportion of public transport journeys has risen slightly. These figures are based on the number of journeys, not the kilometres travelled (passenger-kilometres). Furthermore, air travel has not been taken into account here.
If we look at passenger-kilometres, a different picture emerges:
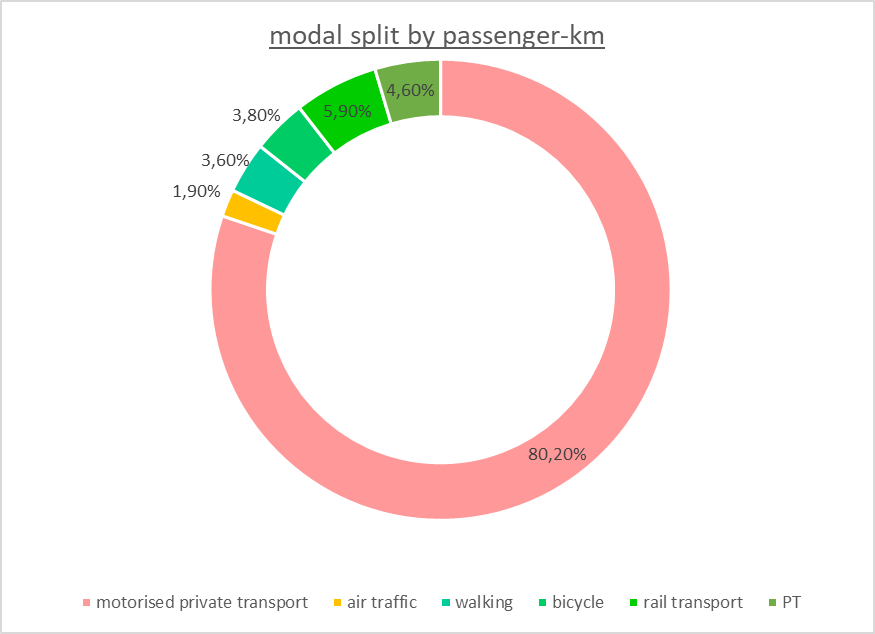
modal split by passenger km
Here, car traffic accounts for a total of 80% of passenger-kilometres travelled. Eco-friendly transport, by contrast, accounts for only around 18% (the remainder being air travel). In order to achieve a shift away from cars and motorised private transport (MPT) towards eco-friendly transport, the barriers to using public transport rather than MPT must be identified and largely removed. To identify the factors preventing people from using public transport, it is necessary to measure and compare the quality of public transport and MIV, thereby identifying where the quality of public transport can be improved (“you cannot improve what you cannot measure”).
A key reason for choosing to use a car rather than public transport lies in the accessibility of public transport. Naturally, there are significant differences between urban and rural areas in this regard. In cities, there is often a very extensive range of public transport options such as suburban trains, underground trains, trams and buses, as well as alternative modes of transport like car-sharing schemes, whereas this is often rarely the case in rural regions.
There are now a variety of initiatives aimed at measuring the quality of public transport provision. We will be presenting some of these in our BLOG over time. datagon GmbH has also developed software as a ‘minimum viable product’ for this purpose, which will be presented in detail here in due course.
Most efforts to measure the quality of public transport services focus on accessibility, i.e. how easy it is to reach public transport. This is often expressed in quality indicators ranging from A to F and is usually depicted on maps using square or hexagonal ‘tiles’ of varying sizes, with different colours assigned depending on the quality indicator. Some systems also measure the quality of car travel and compare the journey time from the point of departure to the destination with that of public transport, whereby the journey time by public transport also takes into account the first and last mile on foot or by bicycle.
In future articles, we will gradually outline the efforts already undertaken in the market and by various institutions to quantify the quality of mobility services.